
In the first part of the series of articles entitled Monitoring applications in a nutshell, you learned about a presentation tool that displays and analyzes the data necessary for monitoring our web application. In this sequel, we’ll detail how we automate tracking to minimize predictable errors and prevent possible app crashes.
The aim of our monitoring is to:
- Centralize both server and client workload records – We use Prometheus and Cloudwatch tools to manage this data.
- Monitor the obtained records in detail – Grafana allows us to visualize them based on the data from the first target.
- Ensure the possibility of process automation – Alerting is one of the tools for automating simple monitoring.
What is Grafana alerting and how to set it up?
In the previous article, we defined the most important aspects of performance, load, process, memory and disk monitoring. Data from these monitorings are available on the basis of the aforementioned Prometheus, which together with Cloudwatch is key for alerting.
In short:
- Prometheus: An open-source system that uses a pull model to collect metrics. This means that the Prometheus server regularly calls endpoints in the monitored services and receives metrics from them.
- CloudWatch: An Amazon service that uses a push model (although it also supports pull for some services). Services and applications send their metrics to CloudWatch and visualizations are created based on data from these sources.
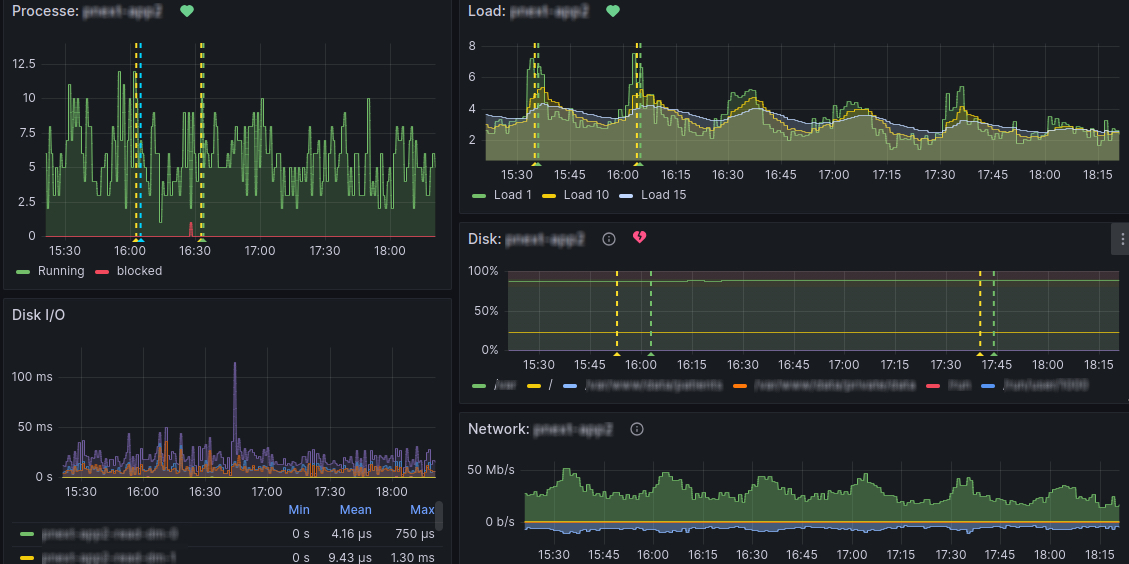
These services send their data to Grafana, which visualizes them. The result looks something like this:

And what do the two dashed lines mean? This is part of automatic monitoring, which can be set as follows:
- In Grafana, you define the Data Source and process it into the form you need.
- Subsequently, the data must be cleaned or edited. NaN or NULL values are usually omitted. However, it’s necessary to consider whether these values aren’t necessary for the correct evaluation of your conditions and whether their removal won’t cause an unwanted ignoring of a potential error.
- Finally, you specify concrete conditions above the output value when the alert goes into one of the following states:
- Normal: No risk.
- Pending: A regular check-up of the conditions is under way and in case one of them is met, the alert is moved to the Firing state.
- Firing: Alerts administrators, and possibly the client, about a potential problem.
It’s very important to determine the conditions of automatic monitoring correctly so that as few false alerts as possible come out, which can cover the really important ones. In the case of frequent repeated warnings or false “alarms”, alerts may begin to be considered untrustworthy. Subsequently, there’s a risk that the administrator will ignore them, and ultimately they’ll lose their original purpose. Thus, the process of defining these conditions is usually not a one-time process, but a long-term one in order to fine-tune all the details.
At Crossuite, we currently have alerts divided into 3 different states:
- Warning indicates a potential problem. The user can set this alert according to different criteria or thresholds. The Warning is displayed to us when the data is returned and modified before the criticality limit we set in advance. If this potential problem isn’t addressed, it could cause a web application outage in the near future.
- Critical is an issue that was previously reported as a Warning but wasn’t resolved, or an issue caused by a sudden error. Both types cause a potential blocking aspect for the user and need to be addressed immediately.
- Business alerts are alerts captured directly based on user interaction.
Example: Alert setting – running out of disk space
One of the very important alerts is disk usage. If the drive runs out, it can have various consequences, such as data loss, service outage or performance problems. Since none of these consequences are acceptable to the end user, we closely monitor disk usage along with many other metrics, of course.
In the following picture, I cut out a few alerts from our automatic monitoring. As you can see, Disk usage isn’t a common problem, as even we have this alert in the Firing state.

How to set up such an alert?
We define the data source for alerts using the query language for Prometheus:
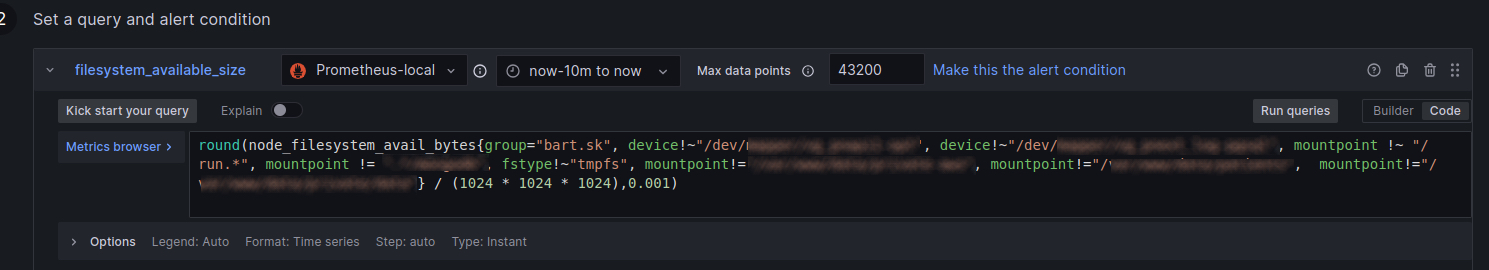
What does this command do? In layman’s terms, we can translate it as follows: “Tell me how much available space in gigabytes there is in each file system belonging to the group ‘bart.sk’, but don’t take into account those that:
- are on certain devices,
- have certain types of file systems,
- are connected in certain places.
For a simpler overview, round the values to the thousandths of a gigabyte.”
Explanation of specific metrics:
- node_filesystem_avail_bytes: This metric contains the number of bytes that are available on the file system.
- {group=“bart.sk“,…}: Filters that determine which file systems should be included or excluded from the results. For example, group= “bart.sk“ means that we only look at file systems that belong to the “bart.sk“ group.
- device!~“/dev/mapper/vg_pnapi1-opt” and similar filters starting with device!~ define the inclusion/exclusion of certain devices (disks or partitions) determined by the string after !~.
- mountpoint !~ „/run.*“ and other mountpoint filters indicate that the results shouldn’t contain certain connected points (places where disks are accessible in the file system) based on a pattern or an exact path.
- Fstype!~“tmpfs“ specifies the inclusion/exclusion of file systems of the „tmpfs“ type, which are temporary file systems stored in RAM.
- mountpoint!=“/var/www/data/private-aws” and others indicate the inclusion/exclusion of specifically connected points from the results.
- / (1024 * 1024 * 1024): This part of the formula converts the value from bytes to gigabytes because 1024 bytes is one kilobyte, 1024 kilobytes is one megabyte, and 1024 megabytes is one gigabyte.
- ,0.001): This section rounds the resulting value to thousandths of gigabytes to make the values clearer.
The query will then display the data to us in the same or similar format as we’ve defined for each file system:

In the next step, if necessary, we can clean non-numeric, undefined or zero values from this data.

Then we define the evaluation conditions on the basis of which this alert will be assigned to defined states (warning, critical, business). We’ve defined the free space using expression that’ll return the value in percentage:
${reduced_filesystem_available_size} /${reduced_filesystem_size}*100

In this case, we’ve set 2 conditions:
Warning condition:
- If the value is less than 15%, the alert enters the PENDING state.
- If this state persists longer than the defined T time, then the alert goes to the WARNING state.
Critical condition
- If the value is less than 10%, the alert enters the PENDING state.
- If this state persists longer than the defined T time, then the alert goes to the CRITICAL state.
In this case, the Critical condition is always superior to the Warning condition.
The resulting alert is then sent to the space defined within the Grafana settings using Webhook. For us, it’s Google Chat.
The form and structure of the alert are defined using the templating language:

Subsequently, individual values can be defined for the template using Annotations and Variables:

The specific notification of lack of disk space then looks like this:

So what happens next?
Of course, each alert should be linked to some graphical visualization thanks to which it’s possible to examine the problem more closely. Here we come to the question from the previous article – what are the dotted lines in the graphs? These are the exact points where the alert has identified a problem. In this way, we can find out what preceded the situation and define the conditions that led to it. The graph in which the alert should identify it is determined using Summary and Annotations with Dashboard UID and Panel ID items.
We’re at the end of the second installment of the Monitoring in a nutshell series and an attentive reader certainly didn’t miss that I haven’t explained what our Business alerts are for. Don’t worry, you’ll learn all about them and how they relate to Loki logs in the next part. See you then, readers 🙂