Crossuite web app is growing in every way. The number of its users, the amount of code, the types of technologies used and, of course, the number of servers on which it runs, are increasing. With this growth, the demands on scalability are also increasing and there’s a need to constantly monitor the utilization of its resources. In order to be able to cover them, we created an application monitoring position on the project. What tools do we use most often in its implementation, which metrics do we track and how does it help us? You’ll learn all this in this and the following blogs.
Grafana is the basis
One of the most important tools for monitoring or displaying data for monitoring our application is Grafana. Currently, we use it in 3 different ways, which together form a functional complex. Only thanks to their combination can we correctly identify the cause of a possible problem. These could include:
- Data visualization – Used to monitor servers.
- Grafana alerting – Alerts us to possible problems using automatic monitoring based on graphs obtained through data visualization (1).
- Loki (Logs) – They allow us to track issues based on functional app logs.
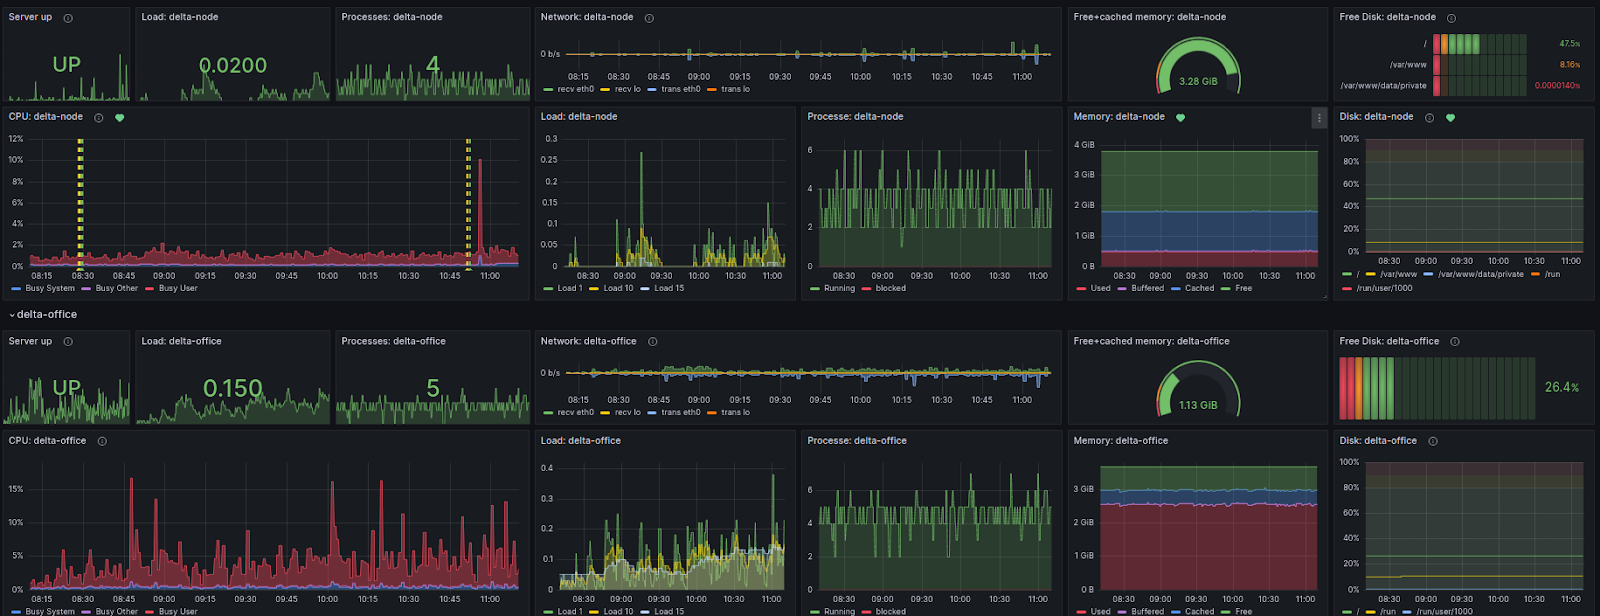
The Crossuite app already has several versions that run on different servers. Accordingly, we have them divided in Grafana itself. We basically monitor the same parameters on each server. Specifically, they are:
CPU (Central Processing Unit): It’s the heart of every computer, including servers. It’s responsible for executing the software instructions and handling the data that is stored in the computer memory. In the context of servers for a web application, it’s important to monitor CPU usage for several reasons:
- Performance: If the CPU is overloaded, it can reduce the speed and efficiency of the web application. This way, the app will work slowly for users or they may even experience loading errors.
- Resource planning: Monitoring CPU usage can help you decide when server resources need to be increased or decreased. For example, if the CPU is constantly overloaded, this may indicate that it’s time to increase computing capacity or optimize the application.
- Security: Abnormally high CPU usage may indicate that the server is under attack or infected with malware.
- Identifying performance issues: CPU monitoring can help identify various web application performance issues, such as inefficient codes or processes that require a disproportionate amount of CPU time.
Load: This metric gives us information about how much work the server is doing and how many processes are waiting for the CPU to process. If the load is high and the wait takes longer, this may indicate that the server is overloaded and needs more computing resources or optimization.
Processes: This is to monitor the number and status of processes running on the server. If too many CPU or memory intensive processes are running, this can lead to server slowdown or even failure. At the same time, this parameter helps us identify unusual processes that could indicate an attack or the presence of malware.
Memory: Memory is a key resource for any server. If it’s inadequate or rapidly depleting, the application may slow down or fail. Monitoring its use thus helps us to identify processes that consume too much of it. At the same time, they signal when it’s necessary to add memory or optimize existing applications.
Network Usage: This parameter refers to the amount of data that is transmitted from and to the server. If network usage is too high, it may cause a slowdown or interruption of the service, which may result in a degradation of the user experience. Excessive network usage can also be an indicator of problems such as DDoS attacks or unauthorized access.
Disk Space: It’s important for the proper functioning of the server and its applications. If the free disk space is too small, it may limit the server’s ability to store new data. This can lead to errors in the application or even stop it. Monitoring free disk space allows administrators to prevent these issues.
How to set the display of parameters in Grafana?
In Grafana, queries are used to create queries and output graphs. The syntax they have depends on the data source. In the case of Crossuite, it’s Prometheus that’s supplied with data from AWS. Therefore, we use PromQL for querying – a functional query language developed specifically for Prometheus. The query to display the CPU parameter in it looks like this:
sum by (instance)
(rate(node_cpu_seconds_total{mode="user",instance="$instance"}[2m]))
/ on() group_right() count without(cpu, mode)
(node_cpu_seconds_total{mode="idle",
instance="$instance"})
Let’s take a look at the different functions:
- node_cpu_seconds_total{mode=”user”,instance=”$instance”}[2m]: Provides a measurement of the total number of seconds the CPU has been in user mode for a particular instance in the last 2 minutes.
- rate(…): Calculates the rate of change per second in the time series, at a given time interval (in this case 2 minutes). This function is most commonly used for measurements that represent monotonous increasing numbers, such as node_cpu_seconds_total.
- sum by (instance)(…): Counts all values by instance. Thus, its result will be the sum of all values for individual instances.
- node_cpu_seconds_total{mode=”idle”, instance=”$instance”}: The measurement records the total number of seconds the CPU was in idle mode for a particular instance.
- count without(cpu, mode) (…): The function counts the number of elements in the time series. In this case, the keyword “without” removes the given dimensions (cpu, mode) from the result.
- … /on() group_right() …: This section performs the operation of dividing two time series.
- on() defines on the basis of which common dimensions the two time series should be compared.
- group_right() specifies that the dimensions from the right side are maintained.
The result of a combination of several such queries is a graph showing the CPU values in a given time interval:
And what do those two dashed lines mean? You’ll find out soon, in the next part of this small series of blogs about monitoring.


