In June 2020, Google Chrome team unveiled a revolutionary way to measure website quality – Web Vitals. You could have read about this groundbreaking news on our blog, for example. This measurement is based on three metrics and Google mainly evaluates the website speed based on those. Since their introduction, my colleagues have been monitoring these parameters on every project we manage. That’s why we didn’t miss that from May 2024, one metric from the trio will be replaced by a novelty – the INP.
The name of the new metric stands for Interaction to Next Paint. It will become a fixed part of Core Web Vitals in May 2024 and aims to better evaluate the quality of the user experience of a website.
According to the information available, the INP will replace the now used First Input Delay (FID) metric. It measures the time it takes for a user to make the first interaction on a page. The word “first” is the key word in this sentence. FID doesn’t take into account other interactions and how long they last.
That’s why the INP was created. It focuses on all interactions and measures the overall response over the lifetime of the site. Thus, the INP provides a more comprehensive picture of the response time to any user actions. According to Google, its value should be within 200 milliseconds.
What do developers have to do?
When organically ranking pages in search, Google takes into account a number of factors – content, location, traffic, number of orders, as well as Core Web Vitals values. That’s why it’s important to monitor and take care of them. But there’s nothing to be afraid of. If a website has so far been achieving an excellent FID score, it’s very likely that the INP will also be in green values.
And if not, Google has introduced a practical guide for developers to improve this metric step by step. The basis is the minification of scripts, the reduction of the DOM tree of the page or the division of longer-lasting tasks into several separate tasks.
Improving the INP is a long-term process that requires patience and effort. It’s important to identify problems with slow interactions, optimise them and retest them. The result should be a web interface that provides users with a fast and seamless interaction and improves the overall experience of browsing the website.
Pro tip at the end – How to check the Core Web Vitals of your web?
Option 1
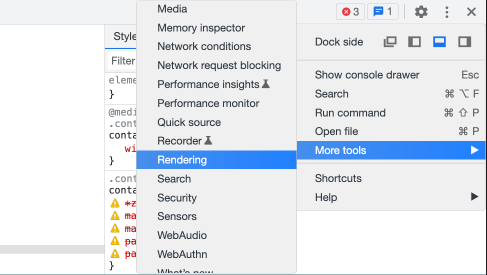
- Open your website in the developer console in Chrome
- Click on 3 dots
- More Tools
- Rendering
- Turn on Core Web Vitals in the list
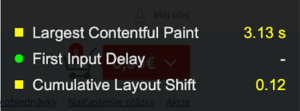
You will then see a black rectangle in the upper right corner of the page with all three metrics and their color-coded values.
Option 2
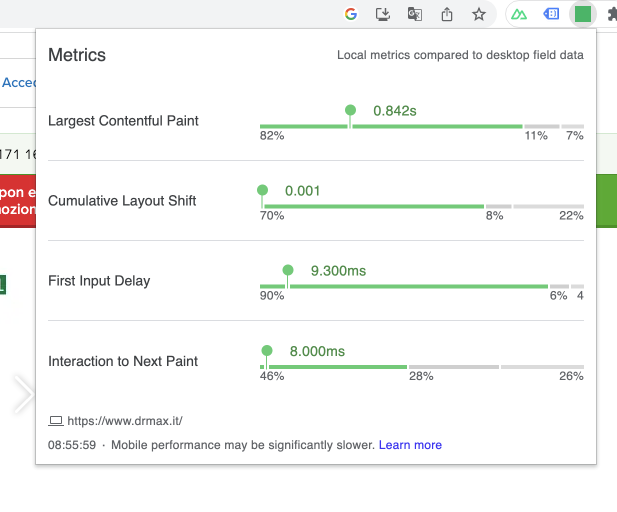
- Use the available extension at https://github.com/GoogleChrome/web-vitals-extension and you will obtain even more information in the following format:

- Through settings – right-click on the plugin icon – you can further customize the display as per your preferences.

Ideal Core Web Vitals values to recap:
Enjoy the optimization!


