Mr. Tomáš Madliak installed the very first server in bart, which was placed in a cardboard box so that it wouldn’t be too loud. 25 years later, he came back. This time in order to help us set up effective monitoring of data from all servers and clouds running the Crossuite project.
Today, the concept of SRE, site reliability engineering, resonates through the IT world. This discipline is relatively new in Slovakia and focuses, as the name suggests, on building and maintaining reliable services. In practice, it’s mainly about collecting and evaluating data that will help us better understand how users operate within services and to analyze in depth the causes of possible errors.
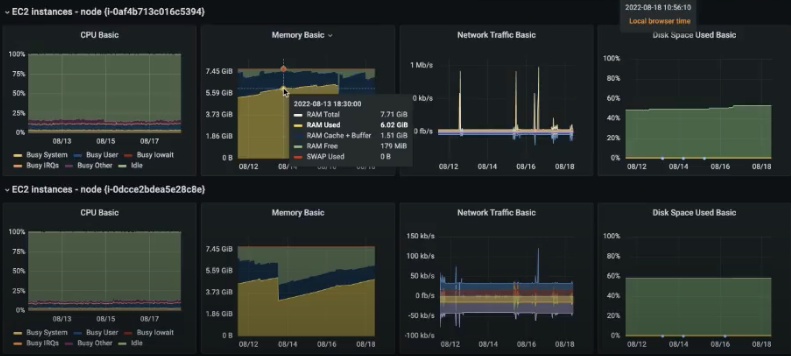
Thus, it’s the so-called higher monitoring, in which we can measure system information, such as CPU load, memory consumption (RAM and disk), IO operations taking place above the disk, number of queries for individual services, etc. This data allows us to obtain a comprehensive overview of the “health” status of an application and to streamline the functioning of databases, APIs or individual services.

In addition, thanks to this monitoring, we can accurately map the path to any problem that appears on a project – where the user clicked, what function it triggered, what this function caused, where exactly it got stuck and what was the reason. A person who understands this data can practically immediately propose improvements to projects and, in cooperation with the team of developers, immediately introduce them to production.
On the Crossuite project, this person is Erik, who together with Mr. Madliak designed the infrastructure for collecting data from approximately 40 server repositories and cloud services where the project runs. This solution works directly on Amazon Cloud (AWS – Amazon Web Services) partly in a serverless form. This ensures high service availability, simpler and also automatic scalability, pre-installed services and partial AWS management.
All metrics are saved via the open-source tool Prometheus. Subsequently, they’re sent to the Grafana platform, where they can be displayed in a structured form, such as charts or tables

„Such monitoring gives us the opportunity to solve possible problems with the application before they even occur. Instead of resolving a crisis situation, we can effectively prevent it. Another benefit is that we can evaluate the behavior of users (which functionalities they use most often, when they log in to the system, etc.) and thus better design the application itself. This should be reflected in particular in its speed, security and, of course, client satisfaction as well.” – Erik |
And what new optimizations prepared on the basis of the obtained data will be added to Crossuite? I’m sure you’ll read about it on our blog.


